Power BI is a state-of-the-art business intelligence tool provided by Microsoft to analyze and visualize raw data to present workable information. It includes business analysis, data recognition, and advanced processes that help an organization make data-driven decisions. In February 2019, Gartner confirmed Microsoft as the Leader of the “2019 Gartner Magic Quadrant for Analytics and Business Intelligence Platform” because of its Power BI platform capabilities.
What is Power BI?
Power BI is a business statistics service provided by Microsoft that allows you to visualize your data and share information. It converts data from various sources to create interactive dashboards with Business Intelligence reports.
Why Power BI?
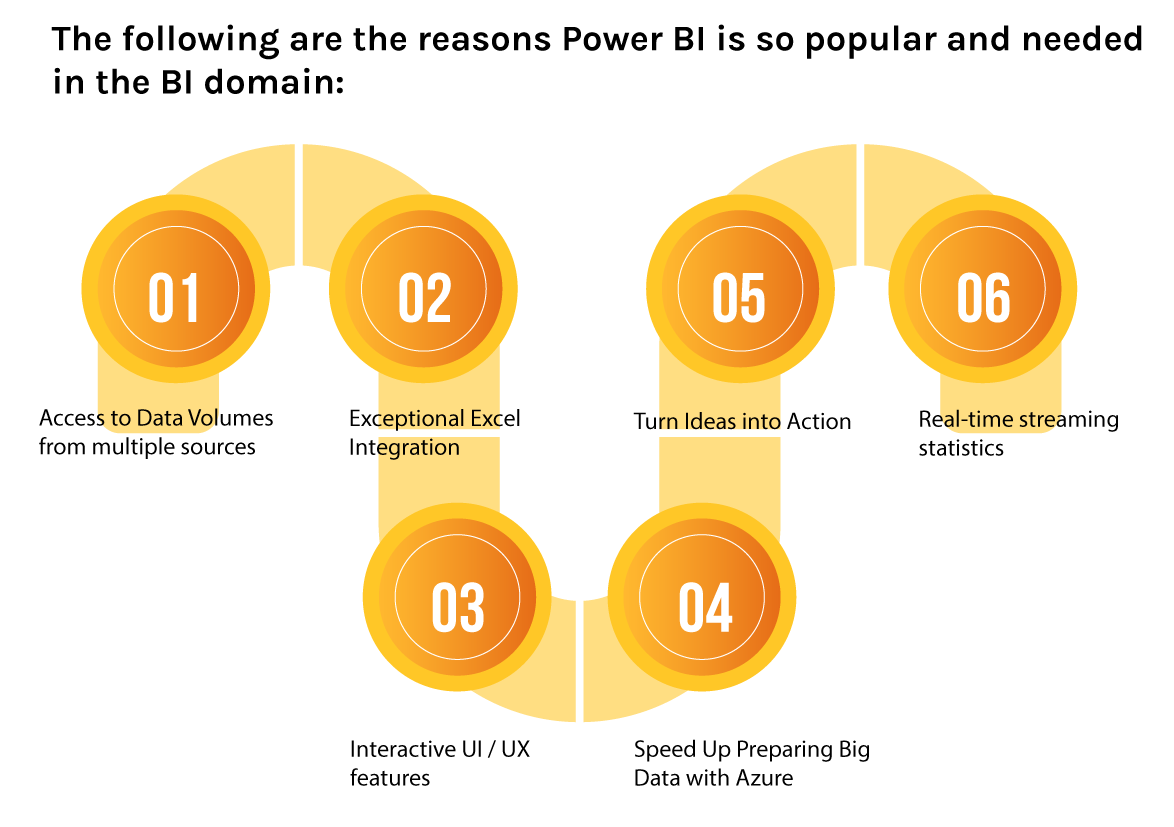
The following are the reasons Power BI is so popular and needed in the BI domain:

Access to Data Volumes from multiple sources
Power BI can access large amounts of data from multiple sources. Allows you to view, analyze, and visualize multiple amounts of data that can be opened in Excel. Some of the most important data sources available for Power BI are Excel, CSV, XML, JSON, pdf, etc. It uses powerful compression algorithms to import and store data within an .PBIX file.
Interactive UI / UX features
Power BI makes things look attractive. It has easy drag-and-drop functionality, with features that allow you to copy all formats to all the same displays.
Exceptional Excel Integration
Power BI helps to collect, analyze, publish, and share Excel business data. Anyone familiar with Office 365 can easily connect Excel queries, data models, and report to Power BI Dashboards.
Speed Up Preparing Big Data with Azure
Using Power BI with Azure allows you to analyze and share large volumes of data. The azure data pool can reduce the time to get information and increase collaboration between business analysts, data engineers, and data scientists.
Turn Ideas into Action
It lets you access the information from data and convert that information into action to decide for your data-driven business.
Real-time streaming statistics
It will allow you to perform broadcast statistics in real-time. It helps you download data from multiple sensors and social media to gain access to real-time statistics, so you can always be ready to make business decisions.
Power BI Architecture

Its Architecture is an Azure-based service. There are many Power BI data sources to which you can connect. Power BI Desktop lets you create reports and data recognition from the database. The gateway is connected to local data sources for continuous reporting and analysis of data. Power BI services refer to cloud services used to publish Power BI reports and data recognition. Using its mobile applications, you can stay connected to their data anywhere. Its apps are available for Windows, iOS, and Android forums.
Components of Power BI
Power Query
Power Query is a data modification and integration engine which allows you to discover, connect, merge, and refine your data sources to meet your analytical needs. It can be downloaded as an Excel extension or used as part of the Power BI Desktop.
Power Pivot
Power Pivot is a data creation technique that allows you to create data models, establish relationships, and create statistics. Uses Data Analysis Expression (DAX) language to model simple and complex data.
Power View
Power View is a technology available in Excel, SharePoint, SQL Server, and Power BI. It allows you to create interactive charts, graphs, maps, and other visual elements that make your data come alive. It can connect to data sources and filter the data for each data display item or the entire report.
Power Map
Microsoft Excel Power Map and Power BI is a 3-D data display tool that lets you map your data and organize over a million data lines by looking at Bing maps in the 3-D format in Excel table or Data Model in Excel. Power Map also works with Bing maps to get excellent visibility based on latitude, longitude, country, region, city, and street address information.
Power BI Desktop
Power BI Desktop is a development tool for Power Query, Power Pivot, and Power View. With Power BI Desktop, you have everything under the same solution, and it is easy to improve BI and data analysis skills.
Power Q&A
The Q&A feature in it lets you view your data in your own words. It is the fastest way to get feedback on your data using natural language. For example, what could be the total amount sold last year? Once you have built your data model and uploaded it to the Power BI website, you can ask questions and get answers quickly.
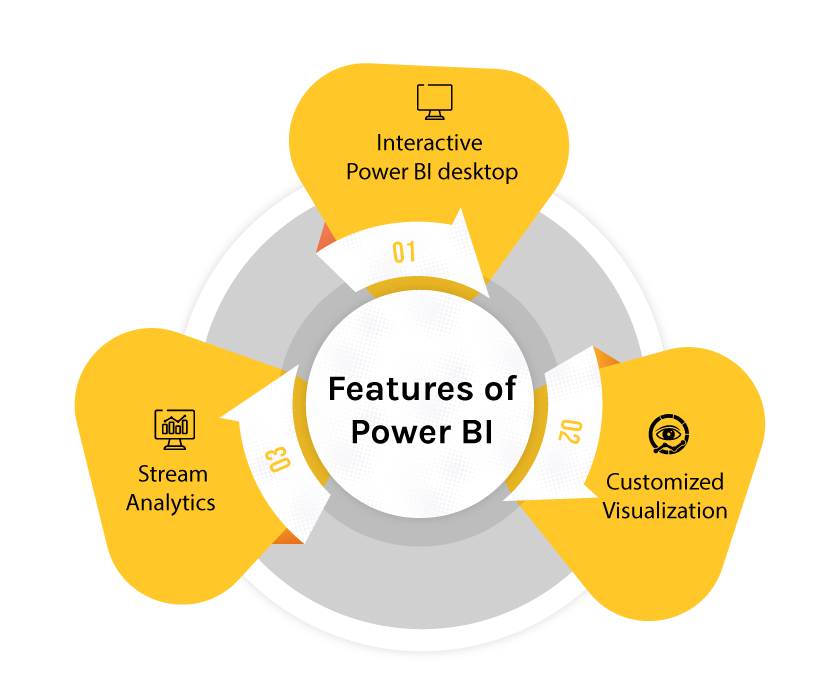
Features of Power BI
Following are some features of Power BI –

Interactive Power BI desktop
This interactive Power BI desktop tool lets you create reports by quickly accessing data. One does not need to have advanced skills to report on this powerful tool. It is fast and easy to learn and use. Also, the best thing about its tool is that it is free to download the tool, which allows you to create reports with no technical knowledge.
Customized Visualization
Every organization works differently and has its way of doing things. Sometimes the right way to go is the normal way. However, the same thing applies to visual aids.
The tool has a default setting, sometimes insufficient for organizations due to complex data. Under such circumstances, organizations can easily access a custom library and create an image that meets your needs.
Stream Analytics
The center for all business data, and the biggest challenge organizations face today, is to manipulate data and other data sets to get useful information.
However, an effective way to do that is to collect various data sets and organize them visually for a better understanding. This form helps to bring a deeper understanding of the data through which organizations can enjoy a competitive advantage over their competitors.
So these were just a few of the features of Power BI. Now, let’s look at what empowers it to deliver information that can work.
It is a single tool that allows the data analysis process to be faster, faster, and user-generated. It not only simplifies data collaboration, analysis, and sharing but also makes it take the same for him to the next level.
Final Thoughts
Its is an excellent and robust business intelligence tool and will remain in the world of data recognition for a very long time. It enables hundreds of data sources to connect quickly, enriching data with comprehensive reports.
Therefore, if you have doubts about its ability to control the future of the data-driven world, you should know that it is the future and will last long.
Also, CodeStore would love to hear from you, so if you have experience in this field, share your fruitful information and help our dedicated student community.
If you are planning to develop your own mobile apps, then share your queries with us or get in touch with us at sales@codestoresolutions.com.

